INTRODUCTION:
In this lab, our focus to find out how does different masses affect the length of a spring. In order to find out the relationship, we hang a spring at a certain level and starting to attach different weights of masses to its end. We measure the total length of the spring and subtract it from the original length of the spring to determine the stretch of the spring.
To successfully conduct the experiment, we need a spring, a ruler and a plat table 1-2 meters above the group for us to hang the spring.
To continue, we defined our variables as:
- Independent variables: weights of the masses
- Dependent variables: the length of the spring
- Control variables: Length of the spring, initial position of the spring.
HOW TO COLLECT DATA:
We measure the length of the spring based on different masses and then input the values to Logger Pro and find the graph of the best fit.
HYPOTHESIS:
As the weight of the masses increases, the stretch of the spring and the weight of the mass will demonstrate a linear relationship.
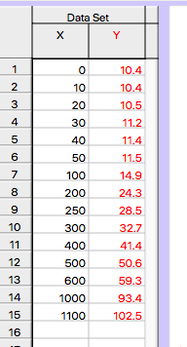
RAW DATA:
X value represents the weight of the mass.
Y value represents the length of the spring.
As the weight of the masses increases, the stretch of the spring and the weight of the mass will demonstrate a linear relationship.
RAW DATA:
X value represents the weight of the mass.
Y value represents the length of the spring.
PROCESSED DATA:
INTERPRETATION:
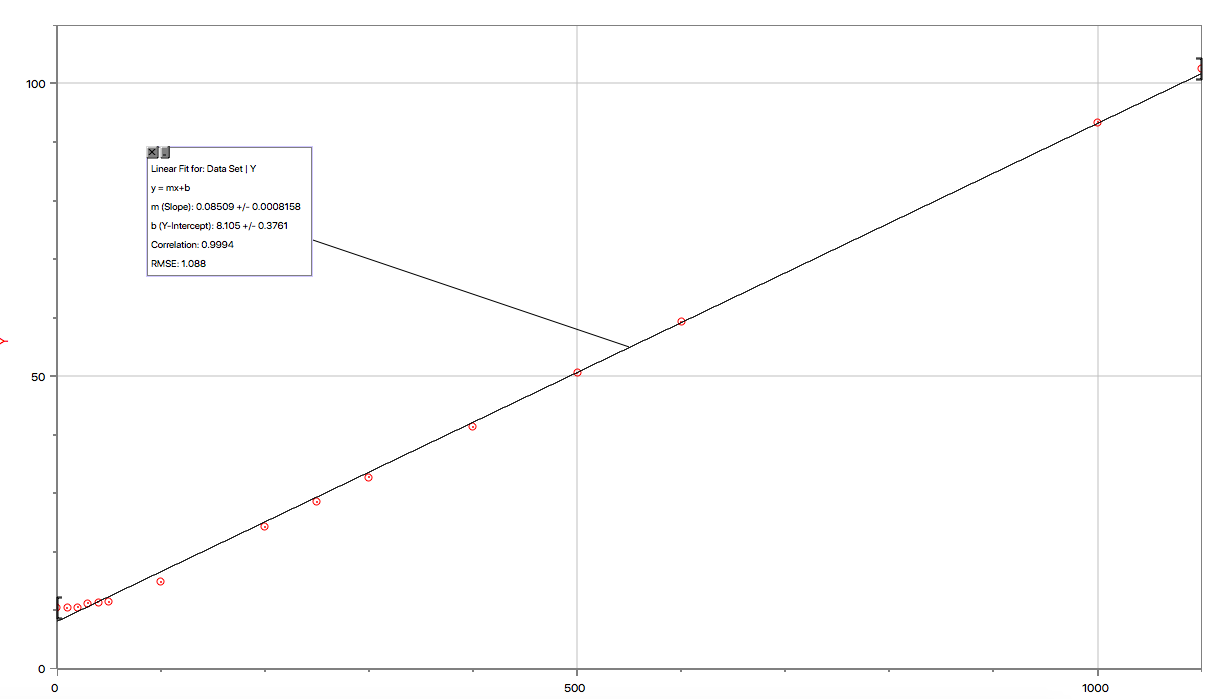
At the end, Logger Pro provides us with an equation of
Length of the Spring=0.085 cm/gram+ 8.1cm
Based on the data collected, we've decided to use a linear graph as the best fit because of its simplicity. The original length of the spring is 10.4cm and as the masses continue to add, the length of the spring demonstrated a linear increase with 0.085cm per gram. However, the data isn't 100% precise due to measuring errors, for example the spring will shake when it reaches a certain length. The data isn't 100% confident because the y-int should be 10.4cm instead of 8.1cm as well.
